


Phoenix Q3 2026: Industrial Space Tightens as Office Finds Its Floor
The same metro, two fundamentally different CRE markets: what Kidder Mathews’ Q3 data means for Arizona tenants, investors, and advisors.
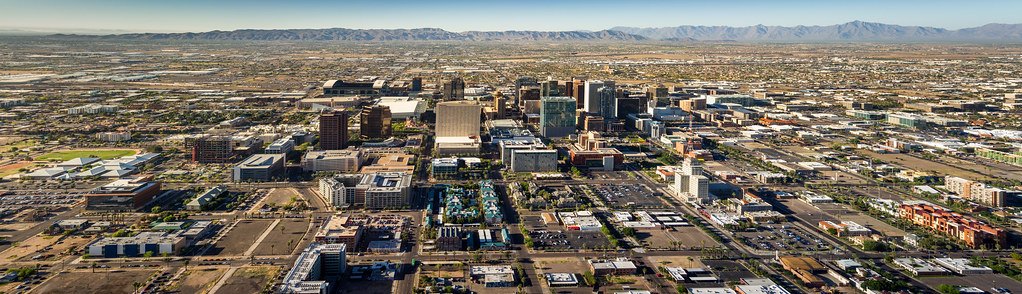
Greater Phoenix’s commercial real estate market put out a report card for the third quarter of 2026, and it reads like two different grades on the same transcript. Industrial space absorbed demand faster than supply could replenish it. The office market posted its first meaningful stabilization signals in years without getting anywhere near equilibrium. What Kidder Mathews’ Q3 2026 data actually shows is not a recovering market or a struggling one: it is a market that has split in two, with the asset class you are working in determining whether you are negotiating from strength or from surplus.
The numbers bear this out in ways that headline vacancy figures obscure. Understanding which side of this split applies to your specific transaction is the most important piece of analysis a CRE professional can deliver right now.
Industrial: Supply Has Corrected Itself
Seven-point-six million square feet leased in a single quarter is not a soft market. Phoenix industrial posted 2.9 million square feet of direct net absorption in Q3 2026, pulling overall vacancy to 11.5 percent, down 1.8 percentage points from a year earlier. Total availability stands at 14 percent, also trending downward. Developers have absorbed the lesson: new deliveries totaled 3.4 million square feet in the quarter, 51 percent below the same period last year, though triple the prior quarter’s subdued pace. That pattern signals cautious restarts rather than a new building boom, which means the pipeline correction is structural rather than a temporary pause.
Rent pricing confirms the shift. Average asking rents have climbed to $1.18 per square foot on a triple-net basis, a 5 percent annual increase that reflects genuine pricing power returning to landlords. When vacancy falls and rents rise simultaneously, you are watching a market move from tenant-favorable to neutral. Phoenix industrial is mid-crossing.
The geographic story within the asset class is equally important. Glendale captured roughly half the quarter’s net absorption, about 1.5 million square feet, driven by its position at the intersection of TSMC’s northwest supply chain and the Loop 202 South Mountain Freeway’s logistics corridors. Chandler North and Gilbert together, and the southwest corridor north of Buckeye Road, each absorbed roughly one-third of Glendale’s total. This concentration is not random. The southwest submarket reflects Buckeye’s build-out as a distribution staging point for California-bound goods. For any industrial user evaluating Phoenix today, tracking which submarket’s absorption trend applies to their operational footprint matters more than the metro-wide vacancy headline.
Office: A 23-Percent Floor Is Still a Floor
The Phoenix office market posted direct net absorption of 23,600 square feet in Q3 2026. That is barely positive, and against a backdrop of 23.7 percent total vacancy (down just 0.1 percentage point), it would be easy to dismiss as statistical noise. But the internal composition tells a more useful story.
Class A space absorbed 48,820 square feet of direct occupancy and an additional 40,300 square feet of subleased space. Class B shrank by 39,236 square feet. Class C added 14,036 square feet. The resulting vacancy stack runs in reverse order of what you would expect from a conventional flight-to-quality narrative: Class A sits at 28.3 percent vacant, Class B at 18.5 percent, Class C at 11.1 percent. The lowest-quality product is functionally the tightest. The highest-quality towers carry the heaviest vacancies because they were overbuilt during the pandemic-era construction cycle and have the most sublease overhang to burn through.
Submarket performance sharpens the picture further. The Central Corridor absorbed 105,600 square feet in Q3. East Phoenix shed 64,600 square feet. Average asking rents of $31.66 per square foot full-service gross, up 2 percent year-over-year, reflect landlord confidence in the trophy end of the spectrum: Class A averages $34.50 per square foot. Office-using employment grew 1.3 percent year-over-year through August 2026, the strongest rate since mid-2022, and Arizona added 17,400 jobs broadly over that period. The labor market signal is that demand exists; the absorption data tells you exactly where it is landing.
The honest read on Phoenix office is that stabilization is real but fragile. A single large tenant relocating or contracting can swing a submarket’s quarterly absorption figure. The floor being established at roughly 23 to 24 percent vacancy is still a historically elevated number that will take multiple years of net positive absorption to resolve. What has changed is that the trajectory of deterioration has stopped. That is a precondition for recovery, not a sign of it.
What This Means if You Are Leasing, Investing, or Advising Right Now
The practical implication of a two-speed market is that general advice becomes close to useless. Quoting a Phoenix office tenant the metro-wide vacancy rate tells them almost nothing. A tenant seeking Class A space in the Central Corridor is competing in a recovering pool of demand with rising rents and a landlord who has options. A tenant exploring Class B in East Phoenix has real leverage and a landlord who needs to move vacant floors. Those are structurally different negotiations that happen to share a city and a quarter.
Industrial users face a parallel bifurcation by geography. An occupier evaluating Glendale industrial is entering the market’s single largest absorption engine, where pricing power has returned and concession packages are shrinking. An occupier in a less active submarket has more room to negotiate. An investor acquiring Glendale industrial today is buying into tightening fundamentals with rent escalations already embedded in new leases. An investor looking at a stabilized Class B office asset in East Phoenix is buying at a substantial discount to replacement cost, with a much longer hold period required to justify the basis.
For the advisors in the middle of these transactions, the data rewards precision. A CRE broker or tenant rep who tracks Phoenix at the building-class and submarket level can meaningfully change the economics of a client’s outcome. One who quotes metro averages is describing a market that does not exist in any specific deal. The same holds for capital markets advisors: the bid-ask spread on Class B Phoenix office and on institutional Glendale industrial currently differ by multiples, not margins. Choosing a CRE professional who works Phoenix on a submarket-by-submarket basis, with current quarterly data, is no longer a preference. In a bifurcated market, that specificity is the actual work.
Who are Arizona’s best real estate professionals?
See the honors, or nominate the professional who belongs on the list.
Explore the Real Estate rankings